Data Journalism
Livemark has been created with a focus on data journalism. It provides a complete toolset for working with data, starting from data extraction and ending with a published website containing interactive charts, tables, and other features.
Example
COVID-19 Tracker by Frictionless Data is written in Livemark:
Prerequisites
Create a virtual environment (optional):
$ python3 -m venv .python
$ source .python/bin/activate
And install livemark:
$ pip install livemark
Quick Start
Livemark requires only a few steps from zero to a published project:
First of all, create:
livemark.yamlindex.mdpages/data.md(for example)
Fill in your configuration file:
livemark.yaml
brand:
  text: My Project
about:
  text: My project is for data journalism
site:
  favicon: assets/favicon.ico
github:
  user: <user>
  repo: <repo>
topics:
  selector: h2
links:
  items:
    - name: About Me
      path: https://personal.site
pages:
  items:
    - name: Introduction
      path: index
    - path: pages/data
Run a livereload server locally:
$ livemark start
When you are ready to publish your work, commit the changes and push it to Github. The only missing part now is enabling Github Pages:
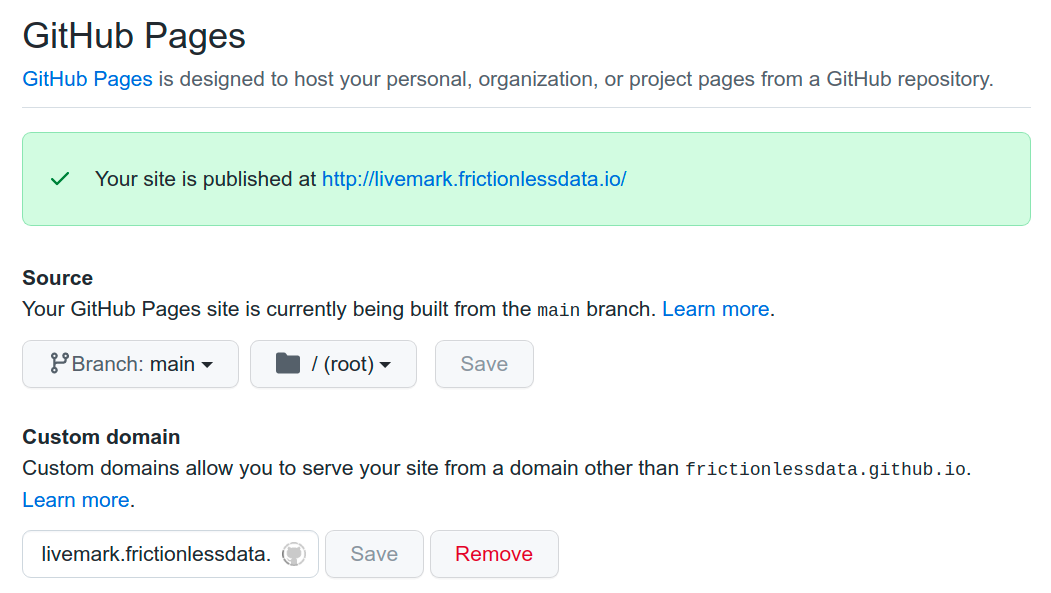
After this step your documentation portal will be up and running.
Data Collection
Livemark ships with a builtin task runner. You can have your tasks written down in your article for better reproducibility as well as making it easier to run them.
data.md
'''bash task id=data-extract
echo 'Data Extract'
'''
'''python task id=data-transform
print('Data Transform')
'''
'''python task id=data-load
print('Data Load')
'''
Use this command to get a list of available tasks:
$ livemark run
data-extract
data-transform
data-load
Execute all of the data tasks:
$ livemark run data
Data Extract
Data Transform
Data Load
Or run an arbitrary task:
$ livemark run data-load
Data Load
Data Visualizations
Livemark provides many ways of visualizing different kinds of data. For example, you can add a chart using a corresponding feature:
'''yaml chart
data:
  url: ../../data/cars.csv
mark: circle
selection:
  brush:
    type: interval
# other options are omitted
width: 500
height: 300
'''
There are many more useful Markdown extensions, for example:
Read the Feature Reference to learn more.