Livemark


Data presentation framework for Python that generates static sites from extended Markdown with interactive charts, tables, scripts, and other features.
Purpose
- Data Journalism: Livemark provides a complete toolset for working with data, starting from data extraction and ending with a published website containing interactive charts, tables, and other features.
- Software Education: Livemark is perfectly suited for writing education materials as it uses code execution model in markdown documents. It solves a range of problems with testing and having your code example up-to-date.
- Python Development: Livemark can be used in software development as a helper tool for working on Python projects. It provides an ability to create documentation sites and works as a task runner.
Examples
Features
- Open Source (MIT)
- Full Markdown compatibility
- Markdown extensions such as tables and charts
- Straight-forward command-line interface
- Much faster than many competitors
- Livereload development server
Logic
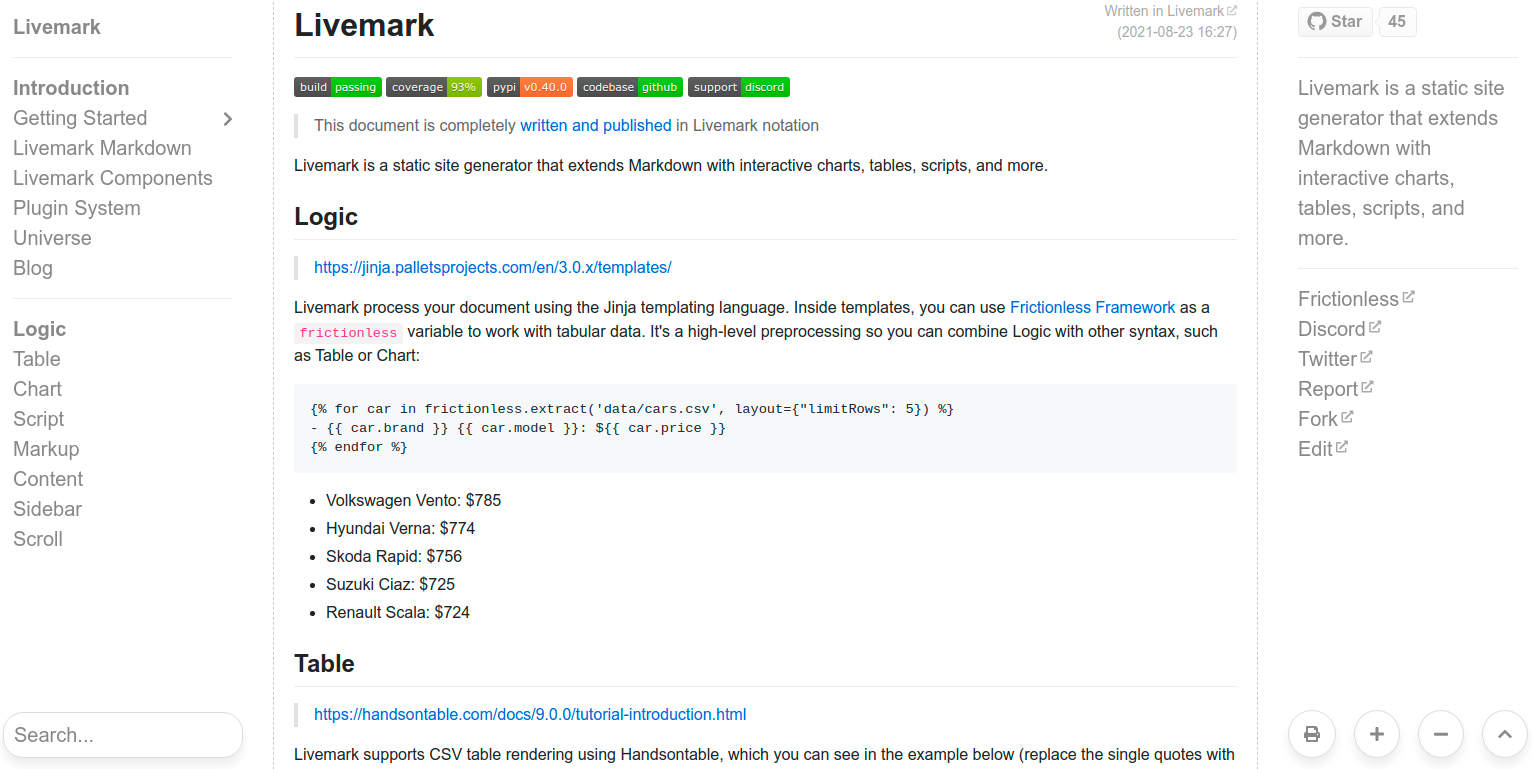
Livemark processes your document using the Jinja templating language. Inside templates, you can use Frictionless Framework as a frictionless variable to work with tabular data. This is a high-level data preprocessing framework so you can combine Logic with other syntax, such as Table or Chart:
{% for car in frictionless.Resource('data/cars.csv').read_rows(size=5) %}
- {{ car.brand }} {{ car.model }}: ${{ car.price }}
{% endfor %}
- Volkswagen Vento: $785
- Hyundai Verna: $774
- Skoda Rapid: $756
- Suzuki Ciaz: $725
- Renault Scala: $724
Table
Livemark supports CSV table rendering using DataTables, which you can see in the example below (replace the single quotes with back ticks). The data property will be read at the build stage so in addition to DataTables options you can pass a file path as data property (CSV/Excel/JSON are supported). Use columns property to customize fields or their order:
'''yaml table
data: data/cars.csv
width: 600
order:
  - [3, 'desc']
columns:
  - data: type
  - data: brand
  - data: model
  - data: price
  - data: kmpl
  - data: bhp
'''
| type | brand | model | price | kmpl | bhp |
|---|---|---|---|---|---|
| Sedan | Volkswagen | Vento | 785 | 16.1 | 104 |
| Sedan | Hyundai | Verna | 774 | 17.4 | 106 |
| Sedan | Skoda | Rapid | 756 | 15.0 | 104 |
| Sedan | Suzuki | Ciaz | 725 | 20.7 | 91 |
| Sedan | Renault | Scala | 724 | 16.9 | 98 |
| Sedan | Suzuki | SX4 | 715 | 16.5 | 103 |
| Sedan | Fiat | Linea | 700 | 15.7 | 112 |
| Sedan | Nissan | Sunny | 699 | 16.9 | 98 |
| Sedan | Fiat | Linea Classic | 612 | 14.9 | 89 |
| Sedan | Toyota | Etios | 603 | 16.8 | 89 |
| Sedan | San | Storm | 595 | 16.0 | 59 |
| Sedan | Chevrolet | Sail | 551 | 18.2 | 82 |
| Hatchback | Volkswagen | Polo | 535 | 16.5 | 74 |
| Hatchback | Hyundai | i20 | 523 | 18.6 | 82 |
| Sedan | Honda | Amaze | 519 | 18.0 | 87 |
| Sedan | Suzuki | Swift DZire | 508 | 19.1 | 86 |
| Sedan | Ford | Classic | 506 | 14.1 | 100 |
| Hatchback | Skoda | Fabia | 503 | 16.4 | 75 |
| Hatchback | Toyota | Etios Liva | 500 | 17.7 | 79 |
| Hatchback | Fiat | Punto Evo | 499 | 15.8 | 67 |
| Sedan | Tata | Indigo | 499 | 14.0 | 65 |
| Sedan | Hyundai | Xcent | 496 | 19.1 | 82 |
| Sedan | Tata | Zest | 481 | 17.6 | 89 |
| Hatchback | Chevrolet | Sail Hatchback | 468 | 18.2 | 82 |
| Hatchback | Suzuki | Swift | 462 | 20.4 | 83 |
| Hatchback | Renault | Pulse | 446 | 18.0 | 74 |
| Hatchback | Suzuki | Ritz | 442 | 18.5 | 86 |
| Hatchback | Chevrolet | Beat | 421 | 18.6 | 79 |
| Hatchback | Honda | Brio | 421 | 19.4 | 87 |
| Hatchback | Hyundai | i10 | 418 | 19.8 | 68 |
| Hatchback | Ford | Figo | 414 | 15.3 | 70 |
| Hatchback | Nissan | Micra | 413 | 19.5 | 67 |
| Hatchback | Suzuki | Celerio | 392 | 23.1 | 67 |
| Hatchback | Suzuki | Wagon-R | 363 | 20.5 | 67 |
| Hatchback | Volkswagen | Up | 360 | 21.0 | 74 |
| Hatchback | Chevrolet | Spark | 345 | 16.2 | 62 |
| Hatchback | Suzuki | Estilo | 338 | 19.0 | 67 |
| Hatchback | Suzuki | Alto | 315 | 24.1 | 67 |
| Hatchback | Nissan | Datsun GO | 312 | 20.6 | 67 |
| Hatchback | Hyundai | EON | 302 | 21.1 | 55 |
| Hatchback | Suzuki | Alto 800 | 248 | 22.7 | 47 |
| Hatchback | Tata | Nano | 199 | 23.9 | 38 |
| type | brand | model | price | kmpl | bhp |
Chart
Livemark supports Vega Lite visualisations rendering (to try this example, replace the single quotes with back ticks):
'''yaml chart
data:
  url: data/cars.csv
mark: circle
selection:
  brush:
    type: interval
# other options are omitted
width: 500
height: 300
'''
Script
Livemark supports Python/Bash script execution inside Markdown. We think of this as a lightweight version of Jupyter Notebooks. Sometimes, a declarative Logic/Table/Chart is not enough for presenting data so you might also want to include the scripts. This example uses Frictionless Framework code to transform the dataset:
from pprint import pprint
from frictionless import Resource, transform, steps

brands = transform(
    Resource("data/cars.csv"),
    steps=[
        steps.table_normalize(),
        steps.table_aggregate(group_name="brand", aggregation={"price": ("price", max)}),
        steps.row_sort(field_names=["price"], reverse=True),
        steps.row_slice(head=5),
    ],
)
pprint(brands.read_rows())
[{'brand': 'Volkswagen', 'price': 785},
 {'brand': 'Hyundai', 'price': 774},
 {'brand': 'Skoda', 'price': 756},
 {'brand': 'Suzuki', 'price': 725},
 {'brand': 'Renault', 'price': 724}]
Markup
https://getbootstrap.com/docs/5.0/getting-started/introduction/
With Livemark you can use HTML inside Markdown with Bootstrap support. Here is an example of creating a responsive grid of cards (note that if we set a livemark-markdown class we can use markdown inside html):
'''html markup
<div class="w-50">
<div class="container">
<div class="row">
<div class="col-sm">
<div class="markdown"></div>
<div class="text-center">
<p><strong>Data Package</strong></p>
<p>A simple container format for describing a coherent collection of data in a single package.</p>
</div>
</div>
<!-- other columns are omitted -->
</div>
</div>
</div>
'''

Data Package
A simple container format for describing a coherent collection of data in a single package.

Data Resource
A simple format to describe and package a single data resource such as a individual table or file.

Table Schema
A simple format to declare a schema for tabular data. The schema is designed to be expressible in JSON.
Please read the full Feature Reference to learn about all of Livemark's features.